A new benchmark for recognizing radio ads
Published on 13 06 2023DVJ Insights, in collaboration with Audify, is introducing a new benchmark for the recognition of radio ads. This benchmark is based on the listening data obtained from the new NMO radio audience measurement.
Recognizing a commercial serves as an initial indication of a successful radio campaign. The media pressure, quantified by the number of Gross Rating Points (GRPs), plays a significant role in determining the percentage of consumers who can still recall the commercial afterwards. DVJ Insights has developed campaign data provided by Audify to create a GRP-dependent benchmark, specifically tailored to the measurement scale of the new NMOradio audience measurement. This innovative measurement method captures listening behaviour through a smartphone app, passively monitoring activity across all devices and platforms. Previously, listening behaviour was measured through the manual completion of radio logs. The introduction of the new radio audience measurement prompts the question: How does this impact the benchmark for radio ad recognition?
Benchmarking the Recognition of Radio Ads
The first step in determining whether an advertising campaign influences consumer behaviour is to determine whether the ad is recognized. Can consumers distinguish between different radio ads, even after the campaign ends? This is not evident as exposure to a broadcasted commercial does not guarantee that it will be registered and recognized by the audience. After all, many other commercial expressions compete for attention on a daily basis. Recognition, therefore, serves as a crucial indicator of campaign success. To assess the performance of a radio campaign accurately, it is essential to have a reliable recognition benchmark that highlights whether the campaign is exceeding or falling short of expectations.
The National Media Research (NMO)
The NMO radio audience measurement serves as the foundation for calculating radio station listening shares, scheduling advertising campaigns, and quantifying media pressure in terms of GRPs. Starting this year, listening behaviour is measured in a different way, which has resulted in different listening figures and GRPs. Previously, listening behaviour was tracked through the completion of radio logs. The new methodology utilizes a smartphone app to collect listening data, which monitors listening behaviour without you noticing it via audio matching on all devices and platforms.
A New GRP-Dependent Benchmark for Radio Ads
DVJ Insights has created a GRP-dependent benchmark for radio campaign recognition. However, this benchmark is based on listening figures and GRPs derived from the old measurement method. It does not align well with the new research that registers listening behaviour through the app. Since there is no universal and consistent rule to convert GRPs from ‘old’ to ‘new’ values, we decided to redevelop our benchmark.
Research on Radio Ads
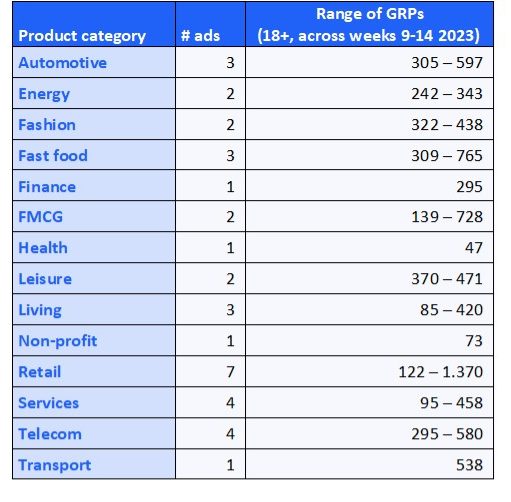
In the development of this new benchmark, DVJ Insights collaborated with Audify, the marketing organization for audio creators and users. Over several weeks, radio adswere introduced to the public for the first time during specific research periods. These commercials were then incorporated into a weekly online questionnaire, where respondents’ familiarity with the commercials was evaluated after listening to them. A total of 36 radio adswere analysed for recognition over a period of four to six weeks, with a minimum sample size of 100 respondents per commercial per week. Table 1 illustrates the inclusion of various categories and sectors:
Table 1: Number of Commercials and GRP Distribution by Category

Audify provided us with weekly realized GRP numbers per campaign, based on the new measurement approach via the app. Combined with the weekly recognition scores obtained from the research, this data allows the utilization of regression models to measure and predict whether a commercial’s recognition performance exceeds or falls below expectations, taking into account the actual number of GRPs deployed.
Underlying Principles of the Regression Model
There are three main underlying principles behind the regression model:
- Decay Effect: The model incorporates a carryover effect to account for the influence of media pressure in a given week and the recollection of GRPs from previous weeks.
- Diminishing Returns: The model assumes diminishing returns on the number of GRPs deployed. In other words, as the number of GRPs increases, additional GRPs have a more impact on contact frequency and contribute less to the number of individuals reached. Therefore, the effect of additional GRPs on recognition rates is minor.
- Variation in Creative Power: The dataset comprises commercials with differing GRP returns, representing the impact of each GRP on final recognition. This aspect is crucial for obtaining a GRP-dependent benchmark that differentiates between commercials that achieve varying levels of commercial recognition based on their creative power.
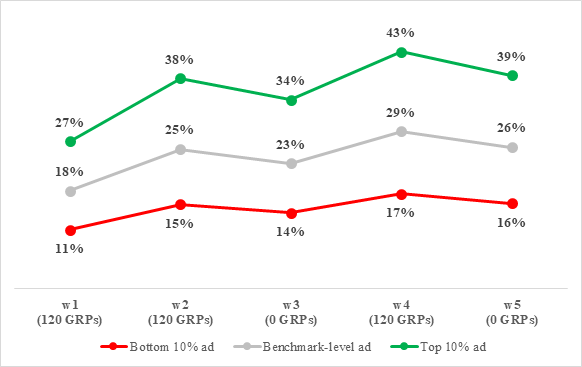
Figure 1 demonstrates how the model operates when benchmarking commercial recognition, displaying the expected weekly recognition scores for a radio campaign deploying 120 GRPs per week for the first two weeks, followed by a GRP-free week, and concluding with another week of 120 GRPs. The model presents three scenarios: one in which the commercial belongs to the bottom 10% in terms of GRP return, one in which it belongs to the top 10% and one that falls precisely in the middle, aligning with the benchmark.
Figure 1: Expected Weekly Recognition Scores at Different Levels of Creative Power

The graph illustrates that, following a four-week campaign consisting of a total of 360 GRPs, an “average” radio adsis expected to be recognized by 26% of consumers. However, if the commercial were classified as a top 10% performer, the expected recognition would rise to 39%. By comparing actual scores with the expected scores derived from the model, recognition can be effectively benchmarked.
Naturally, DVJ Insights and Audify are interested in assessing the differences between the results of the new listening survey and our new recognition benchmark compared to those of the previous benchmark based on the old listening survey. Figure 2 showcases the expected recognition scores for different GRP levels at the conclusion of a four-week campaign. GRPs are evenly distributed across the weeks for both the “old” and “new” benchmark models.
Figure 2: Expected Recognition Scores for Both Benchmark Models after a 4-Week Campaign with Different Numbers of GRPs

Requiring Less Media Pressure for Equivalent Recognition
How does the new benchmark compare to the old one? Under the new benchmark model, we predict a higher recognition score for every level of GRPs. This aligns with expectations since a specific number of GRPs now translates to a higher media pressure due to the new method of measuring listening behaviour. For instance, a radio ad with an average number of GRPs (350, according to the new smartphone app audience measurement ) would be expected to be recognized by 24.7% of consumers at the end of the campaign, according to the new benchmark model. In contrast, the same recognition score would have required 771 GRPs (according to the old listening survey via radio logs) under the old benchmark model.
This indicates a GRP ratio of 2.2, meaning that the new methodology requires 2.2 times fewer GRPs to achieve an equivalent recognition score.
Read more about radio as a medium for advertising
What are the effects of cross-media advertising? And what channel combines with radio the best? Read in this article.